Category: Pipeline

How Do You Steer Towards Success? The North Star Metric
I have been thinking a lot about aligning product teams with product strategy. Here’s a post about one tool in the alignment arsenal. The North Star.
What’s a North Star Metric Anyway?
A North Star Metric (NSM) is the one metric that matters most. It represents the core value your product delivers to users and serves as your guiding light for long-term success. It keeps your team aligned, focused, and moving in the right direction. Simple as that.
Why Bother With a North Star Metric?
Having a North Star Metric means you’re not chasing random numbers that look good but don’t really matter. Here’s why it’s a game-changer:
1. Keep Your Eye on the Prize
Forget vanity metrics. Your NSM ensures you’re tracking what really moves the needle for users and the business.
2. Get Everyone on the Same Page
From product to marketing to ops, everyone should be rowing in the same direction. A solid NSM helps teams sync up.
3. Build for the Long Haul
Short-term wins are great, but sustainable growth is the goal. A good NSM makes sure you’re scaling in the right way.
How to Pick a North Star Metric That Works
A great NSM should be simple, actionable, and tied to real business outcomes. Here’s how you figure it out:
1. Understand Your Core Value
Ask yourself: What’s the main reason people use our product? Your NSM should reflect the value users get from it.
2. Connect It to Growth
If your NSM improves but your business isn’t growing, you’ve got the wrong metric. Pick something that’s directly tied to success.
3. Make It Measurable
If you can’t track it, you can’t improve it. Your NSM should be easy to monitor and analyze.
4. Don’t Ignore Other Metrics
A North Star Metric is important, but it’s not the only thing you should track. Pair it with other KPIs for a complete picture.
Real-World North Star Metrics
Some of the biggest companies out there rely on their North Star Metrics to guide growth:
- Airbnb → Nights booked (measures marketplace health and user value)
- Spotify → Minutes streamed (tracks engagement and content value)
- Slack → Messages sent per user (measures engagement and product dependency)
Each of these metrics is directly linked to user experience and business success. They’re not just numbers—they tell the story of product value.
Picking the Wrong North Star Metric? Here’s What Happens
Messing up your NSM can lead to some bad decisions. Avoid these common pitfalls:
1. Chasing Vanity Metrics
Page views, downloads, or social media followers might look great, but they don’t necessarily mean you’re delivering value.
2. Making It Too Complex
If it takes a whole team just to calculate your NSM, it’s too complicated. Keep it simple.
3. Ignoring User Experience
A metric focused purely on revenue might drive bad decisions—like aggressive upselling—that hurt user trust.
4. Choosing a Short-Term Fix
A good NSM isn’t about short-term wins. It should reflect the bigger picture and long-term success.
How to Use a North Star Metric to Actually Get Results
Having an NSM is one thing. Making it work for you is another. Here’s how to put it to good use:
1. Let It Guide Your Decisions
Use your NSM to prioritize product updates, marketing campaigns, and operational strategies.
2. Track It Like a Hawk
Measure your NSM over time to understand trends and make data-driven decisions.
3. Keep Everyone in the Loop
Make sure the whole company knows what the NSM is and why it matters.
4. Be Willing to Adapt
If your NSM isn’t driving the right behaviors, change it. Business evolves, and so should your metric.
Wrapping Up
A well-chosen North Star Metric keeps teams focused, drives meaningful growth, and ensures your product delivers real value. But remember, it’s not set in stone.
Bottom Line
As a team, stay focused; Stay aligned; Keep moving towards success. Your North Star Metric is your roadmap, make sure it’s taking you where you actually want to go.
Don’t have an NSM, let’s talk about setting one.

Building Resilient .NET Applications using Polly
In distributed systems, outages and transient errors are inevitable. Ensuring that your application stays responsive when a dependent service goes down is critical. This article explores service resilience using Polly, a .NET library that helps handle faults gracefully. It covers basic resilience strategies and explains how to keep your service running when a dependency is unavailable.
What Is Service Resilience
Service resilience is the ability of an application to continue operating despite failures such as network issues, temporary service unavailability, or unexpected exceptions. A resilient service degrades gracefully rather than crashing outright, ensuring users receive the best possible experience even during failures.
Key aspects of resilience include:
- Retrying Failed Operations automatically attempts an operation again when a transient error occurs.
- Breaking the Circuit prevents a system from continuously attempting operations that are likely to fail.
- Falling Back provides an alternative response or functionality when a dependent service is unavailable.
Introducing Polly: The .NET Resilience Library
Polly is an open-source library for .NET that simplifies resilience strategies. Polly allows defining policies to handle transient faults, combining strategies into policy wraps, and integrating them into applications via dependency injection.
Polly provides several resilience strategies:
- Retry automatically reattempts operations when failures occur.
- Circuit Breaker stops attempts temporarily if failures exceed a threshold.
- Fallback provides a default value or action when all retries fail.
- Timeout cancels operations that take too long.
These strategies can be combined to build a robust resilience pipeline.
Key Polly Strategies for Service Resilience
Retry Policy
The retry policy is useful when failures are transient. Polly can automatically re-execute failed operations after a configurable delay. Example:
var retryPolicy = Policy
    .Handle<HttpRequestException>()
    .OrResult<HttpResponseMessage>(r => !r.IsSuccessStatusCode)
    .WaitAndRetryAsync(3, retryAttempt => TimeSpan.FromSeconds(Math.Pow(2, retryAttempt)),
        onRetry: (outcome, timespan, retryCount, context) =>
        {
            Console.WriteLine($"Retry {retryCount}: waiting {timespan} before next attempt.");
        });
Circuit Breaker
A circuit breaker prevents an application from continuously retrying an operation that is likely to fail, protecting it from cascading failures. Example:
var circuitBreakerPolicy = Policy
    .Handle<HttpRequestException>()
    .OrResult<HttpResponseMessage>(r => !r.IsSuccessStatusCode)
    .CircuitBreakerAsync(
        handledEventsAllowedBeforeBreaking: 3,
        durationOfBreak: TimeSpan.FromSeconds(30),
        onBreak: (outcome, breakDelay) =>
        {
            Console.WriteLine("Circuit breaker opened.");
        },
        onReset: () =>
        {
            Console.WriteLine("Circuit breaker reset.");
        });
Fallback Strategy: Keeping Your Service Running
When a dependent service is down, a fallback policy provides a default or cached response instead of propagating an error. Example:
var fallbackPolicy = Policy<HttpResponseMessage>
    .Handle<HttpRequestException>()
    .OrResult(r => !r.IsSuccessStatusCode)
    .FallbackAsync(
         fallbackAction: cancellationToken => Task.FromResult(
             new HttpResponseMessage(HttpStatusCode.OK)
             {
                 Content = new StringContent("Service temporarily unavailable. Please try again later.")
             }),
         onFallbackAsync: (outcome, context) =>
         {
             Console.WriteLine("Fallback executed: dependent service is down.");
             return Task.CompletedTask;
         });
Timeout Policy
A timeout policy ensures that long-running requests do not block system resources indefinitely. Example:
var timeoutPolicy = Policy.TimeoutAsync<HttpResponseMessage>(TimeSpan.FromSeconds(10));
Implementing Basic Service Resilience with Polly
Example Use Case: Online Payment Processing System
Imagine an e-commerce platform, ShopEase, which processes customer payments through an external payment gateway. To ensure a seamless shopping experience, ShopEase implements the following resilience strategies:
- Retry Policy: If the payment gateway experiences transient network issues, ShopEase retries the request automatically before failing.
- Circuit Breaker: If the payment gateway goes down for an extended period, the circuit breaker prevents continuous failed attempts.
- Fallback Policy: If the gateway is unavailable, ShopEase allows customers to save their cart and receive a notification when payment is available.
- Timeout Policy: If the payment gateway takes too long to respond, ShopEase cancels the request and notifies the customer.
By integrating these resilience patterns, ShopEase ensures a robust payment processing system that enhances customer trust and maintains operational efficiency, even when external services face issues.
Conclusion
Building resilient services means designing systems that remain robust under pressure. Polly enables implementing retries, circuit breakers, timeouts, and fallback strategies to keep services running even when dependencies fail. This improves the user experience and enhances overall application reliability.
I advocate for 12-Factor Apps (https://12factor.net/) and while resilience is not directly a part of the 12-Factor methodology, many of its principles support resilience indirectly. For truly resilient applications, a combination of strategies like Polly for .NET, Kubernetes auto-recovery, and chaos engineering should be incorporated. Encouraging 12-Factor principles, auto-recovery, auto-scaling, and other methods ensures services remain resilient and performant.
By applying these techniques, developers can create resilient architectures that gracefully handle failure scenarios while maintaining consistent functionality for users. Implement Polly and supporting resilience strategies to ensure applications stay operational despite unexpected failures.
Streamlining Dependency Management: Lessons from 2015 to Today
In this throwback Tuesday post, we revamp at a dusty draft post from 2015.
In 2015, I faced a challenging problem. I had to manage dependencies across a suite of interconnected applications. It was crucial to ensure efficient, safe builds and deployments. Our system included 8 web applications, 24 web services, and 8 Windows services. This made a total of 40 pipelines for building, deploying, and testing. At the time, this felt manageable in terms of automation, but shared dependencies introduced complexity. It was critical that all applications used the same versions of internal dependencies. This was especially important because they interacted with a shared database and dependencies can change the interaction.
Back then, we used zip files for our package format and were migrating to NuGet to streamline dependency management. NuGet was built for exactly this kind of challenge. However, we needed a system to build shared dependencies once. It was necessary to ensure version consistency across all applications. The system also needed to handle local, and server builds seamlessly.
Here’s how I approached the problem in 2015 and how I’d tackle it today, leveraging more modern tools and practices.
The 2015 Solution: NuGet as a Dependency Manager
Problem Statement
We had to ensure:
- Shared dependencies were built once and consistently used by all applications.
- Dependency versions were automatically synchronized across all projects (both local and server builds).
- External dependencies are handled individually per application.
The core challenge was enforcing consistent dependency versions across 40 applications without excessive manual updates or creating a maintenance nightmare.
2015 Approach
- Migrating to NuGet for Internal Packages
We began by treating internal dependencies as NuGet packages. Each shared dependency (e.g., ProjB, ProjC, ProjD) was packaged with a version number and stored in a NuGet repository. When a dependency changed, we built it and updated the corresponding NuGet package version. - Version Synchronization
To ensure that dependent applications used the same versions of internal packages:- We used nuspec files to define package dependencies.
- NuGet commands like
nuget updatewere incorporated into our build process. For example, if ProjD was updated,nuget update ProjDwas run in projects that depended on it.
- Automating Local and Server Builds
We integrated NuGet restore functionality into both local and server builds. On the server, we used Cruise Control as our CI server. We added a build target that handled dependency restoration before the build process began. Locally, Visual Studio handled this process, ensuring consistency across environments. - Challenges Encountered
- Updating dependencies manually with
nuget updatewas error-prone and repetitive, especially for 40 applications. - Adding new dependencies required careful tracking to ensure all projects referenced the latest versions.
- Changes to internal dependencies triggered cascading updates across multiple pipelines, which increased build times.
- We won’t talk about circular dependencies.
- Updating dependencies manually with
Despite these challenges, the system worked, providing a reliable way to manage dependency versions across applications.
The Modern Solution: Solving This in 2025
Fast forward to today, and the landscape of dependency management has evolved. Tools like NuGet remain invaluable. However, modern CI/CD pipelines have transformed how we approach these challenges. Advanced dependency management techniques and containerization have also contributed to this transformation.
1. Use Modern CI/CD Tools for Dependency Management
- Pipeline Orchestration: Platforms like GitHub Actions, Azure DevOps, or GitLab CI/CD let us build dependencies once. We can reuse artifacts across multiple pipelines. Shared dependencies can be stored in artifact repositories (e.g., Azure Artifacts, GitHub Packages) and injected dynamically into downstream pipelines.
- Dependency Locking: Tools like NuGet’s lock file (
packages.lock.json) ensure version consistency by locking dependencies to specific versions.
2. Automate Version Synchronization
- Semantic Versioning: Internal dependencies should follow semantic versioning (e.g.,
1.2.3) to track compatibility. - Automatic Dependency Updates: Use tools like Dependabot or Renovate to update internal dependencies across all projects. These tools can automate pull requests whenever a new version of an internal package is published.
3. Embrace Containerization
- By containerizing applications and services, shared dependencies can be bundled into base container images. These images act as a consistent environment for all applications, reducing the need to manage dependency versions separately.
4. Leverage Centralized Package Management
- Modern package managers like NuGet now include improved version constraints and dependency management. For example:
- Use a shared
Directory.Packages.propsfile to define and enforce consistent dependency versions across all projects in a repository. - Define
privateNuGet feeds for internal dependencies and configure all applications to pull from the same feed.
- Use a shared
5. Monitor and Enforce Consistency
- Dependency Auditing: Tools like WhiteSource or SonarQube can analyze dependency usage to ensure all projects adhere to the same versions.
- Build Once, Deploy Everywhere: By decoupling build and deployment, you can reuse prebuilt NuGet packages in local and server builds. This ensures consistency without rebuilding dependencies unnecessarily.
Case Study: Revisiting ProjA, ProjB, ProjC, and ProjD
Let’s revisit the original example that help me figure this out in 2015 but using today’s tools.
- When ProjD changes:
- A CI/CD pipeline builds the new version of ProjD and publishes it as a NuGet package to the internal feed.
- Dependency lock files in ProjB and ProjC ensure they use the updated version.
- Applications automatically update:
- Dependabot identifies the new version of ProjD and creates pull requests to update ProjB and ProjC.
- After merging, ProjA inherits the changes through ProjB.
- Consistency is enforced:
- Centralized package configuration (
Directory.Packages.props) ensures that local and server builds use the same dependency versions.
- Centralized package configuration (
The Results
By modernizing our approach:
- Efficiency: Dependencies are built once and reused, reducing redundant builds.
- Consistency: Dependency versions are enforced across all projects, minimizing integration issues.
- Scalability: The system can scale to hundreds of applications without introducing maintenance overhead.
Conclusion
In 2015, we solved the problem using NuGet and MSBuild magic to enforce dependency consistency. Today, with modern tools and practices, the process is faster, more reliable, and scalable. Dependency management is no longer a bottleneck; it’s an enabler of agility and operational excellence.
Are you ready to future-proof your dependency management? Let’s talk about optimizing your build and deployment pipelines today.
Writing Automated Integration Tests by the Numbers
In this Throwback Tuesday post is a revamped draft post from January 2014 where I wrote about writing SpecFlow tests. Here I am generalizing the processes because I don’t use SpecFlow anymore.
One thing I learned in the Marine Corps was to do things by the numbers. It was a natural fit for my analytical mind. Plus, let’s face it, we were told we were useless maggots as dumb as a rock, and this training method was apparently the easiest way to teach a bunch of recruits. Naturally, it worked great for a dumb rock like me, OORAH!
Because of this lesson, I’ve always tried to distill common processes into neat little numbered lists. They’re easy to refer to, teach from, and optimize. When I find a pattern that works across a wide range of scenarios, I know I’ve hit on something useful. So, with that in mind, here’s how I approach writing automated integration tests by the numbers.
1. Understand the Test Data Needs
The first step in any integration test is figuring out the test data you need. This means asking questions like, “What inputs are required? What outputs am I validating?” You can’t test a system without meaningful data, so this step is non-negotiable.
2. Prepare the Test Data
Once you know what you need, it’s time to create or acquire that data. Maybe you generate it on the fly using a tool like Faker. Maybe you’ve got pre-existing seed scripts to load it. Whatever the method, getting the right data in place is critical to setting the stage for your tests.
3. Set Up the Environment
Integration tests usually need a controlled environment. This might involve spinning up Docker containers, running a seed script, or setting up mock services. Automating this step wherever possible is the key to saving time and avoiding headaches.
4. Run a Manual Sanity Check
Before diving into automation, I like to run the test manually. This gives me a feel for what the system is doing and helps catch any obvious issues before I start coding. If something’s off, it’s better to catch it here than waste time troubleshooting broken automation.
5. Create Reusable Test Components
If the test interacts with a UI, this is where I’d create or update page objects. For APIs or other layers, I’d build out reusable components to handle the interactions. Modular components make tests easier to write, maintain, and debug.
6. Write and Organize the Tests
This is the core of the process: writing the test steps and organizing them logically. Whether you’re using SpecFlow, pytest, or any other framework, the principle is the same: break your tests into clear, reusable steps.
7. Tag and Manage Tests
In SpecFlow, I used to tag scenarios with @Incomplete while they were still under development. Modern frameworks let you tag or group tests to control when and how they run. This is handy for managing incomplete tests or running only high-priority ones in CI/CD pipelines.
8. Debug and Refine
Once the test is written, run it and fix any issues. Debugging is a given, but this is also a chance to refine your steps or improve your reusable components. The goal is to make each test rock-solid and maintainable.
Lessons Learned
Breaking things down by the numbers isn’t just about being organized—it’s about being aware of where the bottlenecks are. For me, steps 1 and 2 (understanding and preparing test data) are often the slowest. Knowing that helps me focus on building tools and processes to speed up those steps.
This approach also makes training others easier. If I need to onboard someone to integration testing:
- Pair with them on a computer.
- Pull out the “Integration Tests by the Numbers” list.
- Call them a worthless maggot as dumb as a rock (just kidding… mostly).
- Walk through the process step by step.
Relevance Today
Even though I don’t use SpecFlow anymore, this process still applies. Integration testing frameworks and tools have evolved, but the principles are timeless. Whether you’re using Playwright, Cypress, or RestAssured, these steps form the foundation of effective testing.
What’s different now is the tooling. Tools like Docker, Terraform, and CI/CD pipelines have made environment setup easier. Test data can be generated on the fly with libraries like Faker or FactoryBot. Tests can be grouped and executed conditionally with advanced tagging systems.
The key takeaway? Processes evolve, but the mindset of breaking things down by the numbers is as valuable as ever. It’s how I keep my integration tests efficient, maintainable, and scalable.
I Hate Double Dippers, Yes I’m Talking About You Duplicate HTTP Poster
My team recently had an issue with a screen in an app allowing users to post a form multiple times. This results in all the posts being processed creating duplicate entries in the database. I didn’t dig into the solution with the team, but it reminded me of all the trouble this type of issue has caused me over the years. Now, I very much appreciate the circuit breaker pattern.
If you don’t have experience with implementing a circuit breaker, you can try a project like Polly.net if you’re using .NET.
http://www.thepollyproject.org/
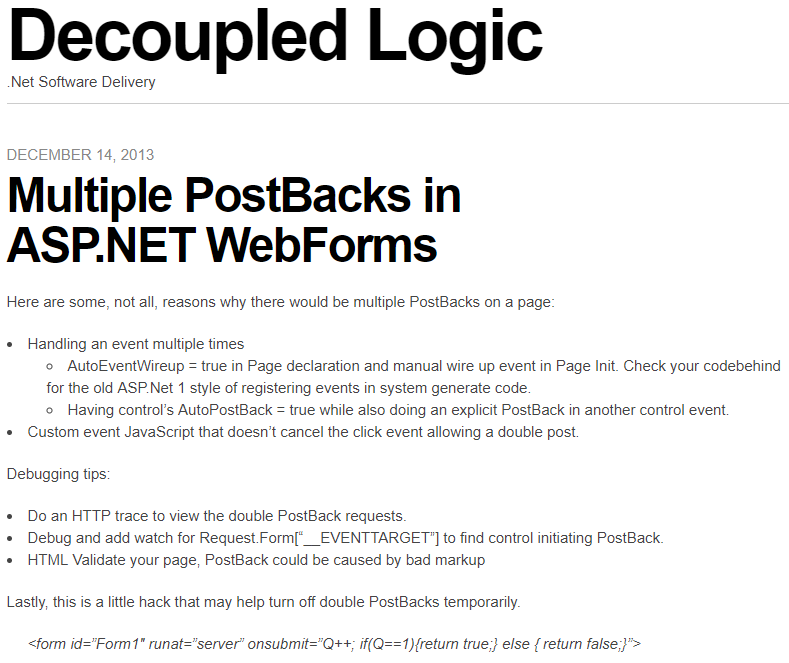
In 2013 I wrote a post about ASP.NET Web Forms (scarey) where I felt the need to capture a hack to prevent double PostBack requests in the client with a circuit breaker. First, I wrote about debugging double PostBack issues. Then I posted a hack to short circuit the post backs. I had no mention of what motivated the post, I just had the sheer need and possibly panic knowing that codebase, to record these notes so I don’t have to figure it out again.
After reading it again, I wondered if I had the notion to force submit to return false only after the first click or if I found this on Google or StackOverflow? This looks like a nice quick trick that worked for me or I wouldn’t have posted it. I wonder if I was being creative, evolutionary, or a pirate (arrrr).
————————————Start Image Quote—————————————-
————————————End Image Quote—————————————-
I don’t know what a good practice for this is today, but I was shocked to see that I was digging so much to simplify this to a bullet list. I wonder if I ever better encapsulated the circuit breaker for this and I wondered what kind of production-issue-induced-anxiety-nightmares I was having.

Observable Resilience with Envoy and Hystrix works for .NET Teams
We had an interesting production issue where a service decided to stalk a Google API like a bad date and incured a mountain of charges. The issue made me ponder the inadequate observability and resilience we had in the system. We had resource monitoring through some simple Kubernetes dashboards, but I always wanted to have something more robust for observability. We also didn’t have a standard policy on timeouts, rate limiting, circuit breaking, bulk heading… resilience engineering. Then my mind wandered back to a video that I thought was amazing. The video was from the Netflix team and it altered my view on observability and system resilience.
I was hypnotized when Netflix released a view of the Netflix API Hystrix dashboard – https://www.youtube.com/watch?v=zWM7oAbVL4g. There is no sound in the video, but for some reason this dashboard was speaking loudly to me through the Matrix or something, because I wanted it badly. Like teenage me back in the day wanting a date with Janet Jackson bad meaning bad.

Netflix blogged about the dashboard here – https://medium.com/netflix-techblog/hystrix-dashboard-turbine-stream-aggregator-60985a2e51df. The simplicity of a circuit breaker monitoring dashboard blew me away. It had me dreaming of using the same type of monitoring to observe our software delivery process, marketing and sales programs, OKRs and our business in general. I saw more than microservices monitoring I saw system wide value stream monitoring (another topic that I spend too much time thinking about).
Unfortunately, when I learned about this Hystrix hotness I was under the impression that the dashboard required you to use Hystrix to instrument your code to send this telemetry to the dashboard. Being that Hystrix is Java based, I thought it was just another cool toy for the Java community that leaves me, .NET dev, out in the cold looking in on the party. Then I got my invitation.
I read where Envoy (on my circa 2018 cool things board and the most awesome K8s tool IMHO), was able to send telemetry to the Hytrix dashboard – https://blog.envoyproxy.io/best-of-all-worlds-monitoring-envoys-activity-using-hystrix-dashboard-9af1f52b8dca. This meant we, the .NET development community, could get similar visual indicators and faster issue discovery and recovery, like Netflix experienced, without the need to instrument code in any container workloads we have running in Kubernetes.
Install the Envoy sidecar, configure it on a pod, send sidecar metrics to Hystrix Dashboard and we have deep observability and a resilience boost without changing one line of .NET Core code. That may not be a good “getting started” explanation, but the point is, it isn’t a heavy lift to get the gist and be excited about this. I feel like if we had this on the system, we would have caught our Google API issue a lot sooner than we did and incurred less charges (even though Google is willing to give one-time forgiveness, thanks Google).
In hindsight, it is easy to identify how we failed with the Google API fiasco, umm.. my bad code. We’re a blameless team, but I can blame myself. I’d also argue that better observability into the system and improving resilience mechanisms has been a high priority of mine for this system. We haven’t been able to fully explore and operationalize system monitoring and alerts because of jumping through made up hoops to build unnecessary premature features. If we spent that precious time building out monitoring and alerts that let us know when request/response count has gone off the rails, if we implemented circuit breakers to prevent repeated requests when all we get in response are errors, if we were able to focus on scale and resilience instead of low priority vanity functionality, I think we’d have what we need to better operate in production (but this is also biased by hindsight). Real root cause – our poor product management and inability to raise the priority of observability and resilience.
Anyway, if you are going to scale in Kubernetes and are looking for a path to better observability and resilience, check out Envoy, Istio, Ambassador and Hystrix, it could change your production life. Hopefully, I will blog one day about how we use each of these.
Welcome to Simple Town, My Notes on ASP.NET Razor Pages
So, I took some time to finally look into Razor Pages and I was impressed and actually enjoyed the experience. Razor Pages simplify web development compared to MVC. Razor Pages reminds me of my failed attempts at MVP with Web Forms, but much less boilerplate. Feels like MVVM and still has the good parts of MVC. That’s because Razor Pages is MVC under the covers. I was able to immediately get some simple work done, unlike trying to get up and working with some of the JavaScript frameworks or even MVC for that matter.
Razor Pages provides a simplified abstraction on top of MVC. No bloated controllers, just bite sized modular pages that are paired with a page model (think Codebehind if you’ve used Web Forms). You don’t have to fuss over routing because routing defaults to your folder/page structure with simple conventions.
You may not want to use it for complex websites that need all the fancy smancy JavaScript interactivity, but simple CRUD apps are a great candidate for Razor Pages. IMHO I think I would select Razor Pages by default over MVC for server side HTML rendering of dynamic data bound websites (but I have very little experience with Razor Pages to stand behind that statement).
Here are some of my notes on RazorPages. This is not meant to teach RazorPages just a way to reinforce whats learned by just diving into it. These notes are the results of my research on questions that I ended up digging through docs.microsoft.com, StackOverflow and Google. Remember I’m still a RazorPage newbie so I may not have properly grasped some of this yet.
Page
A Page in Razor Pages is a cshtml file with the @page directive at the top of the page. Pages are basically content pages scripted as Razor templates. You have all the power of Razor and a simplified coding experience with Page Models. You can still use Razor layout pages to have a consistent master page template for your pages. You also get Razor partial pages that allow you to go super modular and build up your pages with reusable components (nice… thinking user controls keeping with my trip down Web Forms memory lane).
Page Models
Page Models are like Codebehinds from Web Forms because there is a one-to-one relationship between Page and PageModel. In fact, in the Page you bind the Page to the PageModel with the @model directive.
The PageModel is like an MVC Controller because it is an abstraction of a controller. It is unlike an MVC Controller because the Controller can be related to many Views and the PageModel has a beautiful, simplified, easy to understand one-to-one relationship with a Page.
Handlers
A PageModel is a simplified controller that you don’t have to worry about mapping routes to. You get to create methods that handle actions triggered by page requests. There is a well defined convention to map requests to handlers that I won’t go into because there are great sites that talk about the details of everything I bring up in my notes.
https://www.learnrazorpages.com is a great resource to start digging into the details.
BindProperty
BindingProperty is used when you want read-write two-way state binding between the PageModel and Page. Don’t get it twisted, Razor Pages is still stateless, but you have a way to easily bind state and pass state between the client and the server. Don’t worry, I know I keep saying Web Forms, but there is no View State, Sessions, or other nasties trying to force the stateless web to be stateful.
The BindingProperty is kind of like a communication channel between the Page and PageModel. The communication channel is not like a phone where communication can flow freely back and forth. Its more like a walkie talkie or CB radio where each side has to take turns clicking a button to talk where request and response are the button clicks. Simply place a BindingProperty attribute on a public property in the PageModel and the PageModel can send its current state to the Page and the Page can send its current state to the PageModel.
DIGRESS: As I dug into this I wondered if there was a way to do reactive one-way data flow like ReactJS. Maybe a BindingProperty that is immutable in the Page. The Page doesn’t update the BindingProperty when a BindingProperty is changed in the Page. Instead, when the Page wants to update a BindingProperty it would send some kind of change event to the PageModel. Then the PageModel handles the event by updating the BindingProperty which updates the Page state. We may need to use WebSockets, think SignalR, to provide an open communication channel to allow the free flow of change events and state changes.
What do you know, of course this has been done – https://www.codeproject.com/Articles/1254354/Turn-Your-Razor-Page-Into-Reactive-Form. Not sure if this is ready for prime time, but I loved the idea of reactive one way data flow when I started to learn about ReactJS. Maybe there is some real benefit that may encourage this to be built into Razor Pages.
ViewData
ViewData is the same ViewData we’ve been using in MVC. It is used to maintain read only Page state between postback (haven’t written “postback” since web forms… it all comes back around). ViewData is used in scenarios where one-way data flow from PageModel to the Page is acceptable. The page state saved to ViewData is passed from the PageModel to the Page.
ViewData is a data structure, a dictionary of objects with a string key. ViewData does not live beyond the request that it is returned to the Page in. When a new request is issued or a redirect occurs the state of ViewData is not maintained.
Since ViewData is weakly typed, values are stored as objects, the values have to be cast to a concrete type to be used. This also means that using ViewData you loose the benefits of Intellisense and compile-time checking. There are benefits that offset the shortcomings of weak typing. ViewData can be shared with a content Page’s layout and partials.
In a PageModel you can use the ViewData Attribute on public property of the PageModel. This makes the property available in ViewData. The property name becomes the key for the property values in the ViewData.
TempData
TempData is use used to send single-use read-only data from PageModel to the Page. The most common use of TempData is to provide user feedback after post actions that results in a redirect where you want to inform the user of the results of the post (“Hey, such and such was deleted like you asked.”).
TempData is marked for deletion after it is read from the request. There are Keep and Peek methods that can be used to look at the data without deleting it and a Remove method to delete it (I haven’t figured out a scenario where I want to use these yet).
TempData is contained in a dictionary of objects with a string key.
Razor Pages Life Cycle
Lastly, I wanted to understand the life cycle of Razor Pages and how I can plug-in to it to customize it for my purpose. Back to Web Forms again, I remember there being a well documented life cycle that let me shoot myself in the foot all the time. Below is the life cycle as I have pieced it together so far. I know we still have MVC under the hood so we still have the Middlewear pipeline, but I couldn’t find documentation on the life cycle with respect to Razor Pages specifically. Maybe I will walk through the source code one day or someone from the Razor Page team or someone else will do it for us (like https://docs.microsoft.com/en-us/aspnet/mvc/overview/getting-started/lifecycle-of-an-aspnet-mvc-5-application).
- A request is made to a URL.
- The URL is routed to a Page based on convention.
- The handler method in the IPageModel is selected based on convention.
- The OnPageHandlerSelcted IPageFilter and OnPageHandlerSelctedAsync IPageFilterAsync methods are ran.
- The PageModel properties and parameters are bound.
- The OnPageHandlerExecuting IPageFilter and OnPageHandlerExecutionAsync IPageFilterAsync methods are ran.
- The handler method is executed.
- The handler method returns a response.
- The OnPageHandlerExecuted IPageFilter method is ran.
- The Page is rendered (I need more research on how this happens in Razor, I mean we have the content, layout, and partial pages how are they rendered and stitched together?)
The Page Filters are cool because you have access the the HttpContext (request, response, headers, cookies…) so you can do some interesting things like global logging, messing with the headers, etc. They allow you to inject your custom logic into the lifecycle. They are kind of like Middlewear, but you have HttpContext (how cool is that?… very).
Conclusion
That’s all I got. I actually had fun. With all the complexity and various and ever changing frameworks in JavaScript client side web development, it was nice being back in simple town on the server sending rendered pages to the client.
Git Commit Log as CSV
Today, I needed to produce a CSV containing all commits made to a git repo 2 years ago. Did I say I hate audits? Luckily, it wasn’t that hard.
git log --after='2016-12-31' --before='2018-1-1' --pretty=format: '%h',%an,%ai,'%s' > log.csv
To give a quick breakdown:
- git log – this is the command to output the commit log.
- –after=’2016-12-31′ – this limits the results to commits after the date.
- –before=’2018-1-1′ – this limits the results to commits before the date.
- pretty=format:’%h’,%an,%ai,’%s’ – this is outputting the log in the specified format:
- ‘%h’ – hash with surrounded by single quotes
- %an – author name
- %ai – ISO 8601 formatted date of commit
- ‘%s’ – commit message surrounded by single quote.
- > log.csv – output the log to a csv file named log.csv
I surround some values with single quotes to prevent Excel from interpreting the values as numbers or other value that loses the desired format. I had to look through the pretty format docs to find the placeholders to get the output I wanted.
It took a little digging through git docs to get here: https://git-scm.com/docs/git-log and https://git-scm.com/docs/pretty-formats. If I would have been smart and just searched for it I would have landed on this stack: https://stackoverflow.com/questions/10418056/how-do-i-generate-a-git-commit-log-for-the-last-month-and-export-it-as-csv.
Thinking About Microservices
We have been doing more and more work with containers and container orchestration in an effort to manage microservices. So, I have been thinking a lot about microservices and wanted to share some of my ramblings.
When I first heard about microservices I saw no real difference from service oriented architecture (SOA). Today, I still see no real difference, but thinking about microservices helps me see how to do SOA better.
Microservice has many definitions by many people and the meaning of the term is showing signs of standardizing. I still don’t subscribe to a particular definition, but when I think about microservices I have certain things that come to mind.
When I think of a microservice I think of a self-contained distributable versioned package. The package is where I put my custom assemblies and integrated dependent assemblies that I want to ship for consumption. The package contains my interface (UI, API), service, and infrastructure including external services and internal private persistence.
Internal private persistence and state could be something that separates SOA from microservice. Isolating state is one way that this architecture helps limit the bad side effects that come up with shared databases in SOA. Building a system based on microservices is kind of like building a thread safe application. The difference is instead of being able to distribute across threads I want to distribute across the network. Just like isolated state is important in thread safety isolated state (persistence) is important in microservices. There is so much more that can be said on this one point, but I won’t. Just know that isolating state is something I think about and I am still learning about how to deal with this.
Continuing my microservice thoughts, the microservice package has a well defined backwards compatible contract for the service interfaces that provides accessibility to a responsive, focused and cohesive bounded context for a specific domain. The package optionally has the microservice configurations, logs, traces, tests, documentation, SDK, and common services like pulling or pushing logs to a central log server or east-west message based communication with other microservices (e.g. Actor System). This east-west service-to-service communication is a large topic when you bring monolithic relational normalized database thinking to microservices. I still sometimes incorrectly think of how to reduce redundancy across microservices and provide deep relations and dependencies between the service like I would in a monolith. So, thinking about microservice is also retraining my thought process, it’s a paradigm shift.
These microservice distributions are all-in-one neat little packages of independent composable component goodness. I can build a microservice place it in a container and independently ship it through an automated delivery pipeline, continuously monitor it, elastically scale it, deliver the service in a highly available manner that is recoverable from internal failure and still responsive when there are failures in dependent services.
My favorite aspect of a microservice is that it is easy to reason about and maintain. My least favorite aspect of microservice architecture is that it is difficult to reason about and maintain. Microservices are simple because they are small and self contained. They are difficult because when composed together to form a system they constitute a distributed system and distributed systems have been a thorn in the side of my development career. In the end, I still love microservices because there are many new strategies and frameworks to lessen the pain of distributed systems that make building these systems very interesting to me.
An Agile Transformation
I wrote this a few years ago, but I’m going through a similar agile transformation right now. Although, every agile transformation is different, this still makes sense to me although it is just a draft post. I figured I’d just post it because I never search my drafts for nuggets of knowledge :).
If we are going to do Kanban we shouldn’t waste time formally planning sprints. Just like we don’t want to do huge upfront specifications because of waste caused by unknowns that invalidate specs, we don’t want to spend time planning a sprint because the work being done in the sprint can change anytime the customer wants to reprioritize.
We should have a backlog of prioritized features. The backlog is regularly prioritized (daily, weekly…) to keep features available to work. If we want to deliver a specific set of features or features in two weeks, prioritize them and the team will do those features next.
There is a limit on the number of features the team can have in progress (work in progress or WIP). Features are considered WIP until they pass UAT. Production would be a better target, but saying a feature is WIP until production is a little far fetched if you aren’t practicing “real” continuous delivery. So, for our system, production is considered passing UAT. When the team is under their WIP limit they are free to pull the next feature from highest priority features in the backlog.
This is going to most likely reduce resource utilization, but will increase throughput and improve quality. Managers may take issue at developers not being used at full capacity, but there is a reason for this madness and hopefully I can explain it.
Having features pulled into the pipeline from a prioritized backlog instead planning a sprint allows decisions on what features to be worked to be deferred until the last possible moment. This provides more agility in the flow of work in the pipeline and the product owner is able to respond quickly to optimize the product in production. Isn’t agile what we’re going for?
Pulling work with WIP limits also gives greater risk management. Since batch sizes are smaller, problems will only affect a limited amount of work in progress and risk can be mitigated as new work is introduced in the pipeline. This is especially true if we increase the number of production releases. If every change results in a production release we don’t have to worry about the branch and hotfix dance.
Focusing on a limited amount of work improves the speed at which work is done. There is no context switching and there is a single focus on moving a one or limited amount work items through the system at one time. This increases the flow of work even though there may be times when a developer is idle.
The truth is the system can only flow as fast as its slowest link, the constraint. Having one part of the system run at full capacity and overload the constraint introduces a lot of potential waste in the system. If the idle parts of the system worked to help the bottlenecked part of the system, the entire system improves. So having a full system focus is important.
On my current team, we have constraints that determine how quickly we can turn around a feature. Currently, code review and QA are constraints. QA is the largest constraint that limits faster deployment cycles, but more on that later. To optimize our constraints we could follow the five basic steps outlined in the Theory of Constraints (TOC) from the book The Goal:
- Identify the constraint(s) – in this instance it’s code review and manual testing
- Exploit the constraint to maximize productivity – focus on improvements on the constraint
- Subordinate all other steps or processes to speed up or reduce capacity of the constraint – no new work may enter as WIP until the constraint has WIP available
- Elevate the constraint – prioritize work that helps remove the constraint.
- Repeat
To help with the code review constraint the plan is to have developers do code reviews any time WIP stops the movement of work. With this time developers can dig in and do more thoughtful code reviews and look for ways to refactor and improve the code base. Since we are touching code, why not make recommendations to make the code better. So, we can improve what an acceptable pull request is: good syntax, style, logic, tests… everything we can think of to make the codebase more maintainable and easy to validate.
To remove the QA constraint, the plan focuses on developers creating automated tests to help lessen the work that QA has to do. The reason we don’t first focus on optimizing QA processes directly is because focusing on simply optimizing QA processes would actually increases the capacity for QA without increasing the speed at which we can flow work to production. We don’t want to increase the number of features that QA can handle because it is important to take the proper time in testing. What we want to do is remove manual regression checks for QA. Exploiting QA for us means increasing QAs effectiveness freeing up time to do actual testing instead of just following a regression script. Having developers automate regression opens us up to deliver new features to production faster because automation runs these test much faster than QA. QA can focus on what they do best, testing and not running mundane scripted checks. Trick here is how do we convince developers to write automated tests without causing a revolt.
In summary, we would have to wait for a manual regression test cycle to occur and couldn’t introduce new work because it would invalidate the regression test. With automation handling +80% of regression QA can move faster, actually test more, and we can not only increase throughput through the entire system, but the overall quality of the product is also increased.
Monitoring Delivery Pipeline
We track work through the delivery pipeline as features. A feature in this sense is any change, new function, change existing function, or to fix a defect. Features are requested on features kept in a central database. We monitor the delivery pipeline by measuring:
- Inventory
- Lead Time
- Quantity: Unit of Production
- Production Rate
Inventory
Inventory (V) is any work that has not been delivered to the customer. This is the same as work in progress (WIP). This counts all work from the backlog to a release awaiting production deployment. Whenever there is undelivered work and we have to cancel the work for some reason, we considered it an Operational Expense. Canceled work won’t be delivered to production because of defect, incorrect specs, the customer pivoted or otherwise doesn’t want it. Cancelled work is wasted effort and in some cases can also cause expensive un-budgeted rework. In traditional cost accounting inventory is seen as an asset, but in TOC it is a potential Operational Expense if it is not eventually delivered to customer so turning inventory as fast as possible without injecting defects is a goal.
Quantity
Quantity (Q) is the total number of units that have moved through our delivery pipeline. Our unit of production is a feature. When a feature is deployed to production we can increase quantity by one unit. A feature is still considered inventory until it has been delivered to the customer in production. If a customer decides they don’t want the feature or some other reason to stop the deployment of the feature, it is counted as an Operational Expense and not quantity.
Flow Time
Flow time (FT) is the time it takes to move a feature, one unit, from submission to the backlog to deployed to a customer in production.
Production Rate
Production rate (PR) is the number of units delivered during a time period. This is the same as throughput. If we we deliver 3 features to production in a month our production rate is 3 features per month.
Optimize Delivery Pipeline for Flow Time
We should strive to optimize the delivery pipeline for flow time instead of production rate or throughput. The Theory Of Constraints – Productivity Metrics in Software Development posted on lostechies.com explains this well.
Let’s say our current flow time (FT) is 1 unit (Q) in a week or a production rate (PR) of 4 Q per month. If we optimize FT to 1 Q in 3 days, we will see a jump in PR to 6.67 Q per month or a 59% increase.
If we focus on optimizing PR, we may still see improvement in FT, but it can also lead to only an increase in inventory as WIP increases. The PR optimization may increase Q that is undeliverable because of some bottleneck in our system so the Q sits as inventory, ironically in a queue. The longer a feature sits in inventory the more it costs to move it through the pipeline and address any issues found in later stages of the pipeline. So, old inventory can also cause delay down stream as the team must take time to ramp up to address issues after they have moved on to another task.
So, to make sure we are optimizing for FT we focus on reducing waste or inventory in the pipeline by reducing WIP. The delivery team keeps a single purposed focused on one unit or a limited amount of work in progress to deliver what the customer needs right now, based on priority in the backlog. Reducing inventory reduces Operation Expense. (Excuse me if I am allowing some lean thinking into this TOC explanation)
Metrics
Investment
Investment (I) is the total cost invested in the pipeline. In our case we will count this as time invested. We can sum the time invested on each unit in inventory in the pipeline to see how much is invested in WIP. We could count hours in timecards to determine this, but time cards are an evil construct. If we are good about moving cards, or even automated movement of cards based on some event (branch created, PR submitted, PR approved…), we could assign the time a card sits in some state to a standard investment amount in the time it sat. I’m still pondering this, but I feel like time investment based on card movement is way better than logging time.
Operating Expense
Operating expense (OE) is the cost of taking an idea and developing it to a deliverable. This is not to be confused with operational expense which is a loss in inventory or loss in investment. Any expense, variable or fixed, that is a cost to deliver a unit is considered OE. We will just use salaries of not only developers, but BA, QA, IT as our OE. Not sure how we will divide up our fixed salaries, maybe a function that includes time and investment. Investment would be a fraction of OE because all of a developers time is not invested in delivering features (still learning).
Throughput
Throughput (T) in this sense is the amount earned per unit. Traditionally, this is that same as production rate as explained earlier, but in terms of cost, we calculate throughput by taking the amount earned on production rate, features delivered to production, minus the cost of delivering the features or the investment.
Throughput Accounting
To maximize ROI and net profit (NP) we need to increase T while decreasing I and OE.
NP = (T – OE)
ROI = NP/ I
Average Cost Per Feature
Average cost per feature (ACPF) is the average amount spent in the pipeline to create a feature.
ACPF = OE/Q
There are more metrics that we can gather, monitor, and analyze; but we will keep it simple for now and learn to crawl first.
Average Lead Time Per Feature
The average time it takes to move a feature from the backlog to production. We also calculate the standard deviation to get a sense on how varying work sizes in the pipeline affects lead time.
Bonus: Estimating Becomes Easier
When we begin to monitor our pipeline with these metrics estimating becomes simpler. Instead of estimating based on time we switch to estimating based on size of feature. Since we are tracking work, we have a history to base our future size estimates on.
Issues in Transformation
Our current Q is a release, a group of features that have been grouped together for a deployment. We will build up an inventory of features over a month at times before they are delivered to production. This causes an increase in inventory. It would be better to use a feature instead of a release as our Q. When a feature is ready, deliver it. This reduces inventory and increase the speed at which we get feedback.
To change our unit, Q, to feature we have to attack our largest constraint, QA. Currently, we have to sit on features or build up inventory to get enough to justify a QA test cycle. We don’t want to force a two week regression on one feature that took a couple days to complete. So, reducing the test cycle is paramount with this approach.
References
- The Goal: A Process of Ongoing Improvement, by Eliyahu M. Goldratt
- The Phoenix Project: A Novel About IT, DevOps, and Helping Your Business Win, by Gene Kim, Kevin Behr, and George Spafford.
https://www.amazon.com/Phoenix-Project-DevOps-Helping-Business/dp/B00VATFAMI/ref=sr_1_1?s=books&ie=UTF8&qid=1509016772&sr=1-1&keywords=the+phoenix+project
- The Metrics in TOC: Productivity Metrics In Software Development, by erick Bailey, https://lostechies.com/wp-content/uploads/2011/04/TheoryOfConstraints-ProductivityMetricsInSoftwareDevelopment.pdf
- Agile Management for Software Engineering, by David J. Anderson
- Reaching The Goal, by John Arthur Ricketts
- Applying Theory of Constraints to Manage Bottlenecks, by Kamran Khan, http://www.isixsigma.com/methodology/theory-of-constraints/applying-theory-constraints-manage-bottlenecks/
- http://chronologist.com/blog/2012-07-27/theory-of-constraints-and-software-engineering/
- http://chronologist.com/blog/2012-10-04/buffer-management-and-risk-management-in-TOC/
- https://www.timecockpit.com/blog/2013/08/30/Project-Reporting-in-Agile-Projects
